Skip to content
Contact
Member Portal
Main Navigation
Is my Airbag safe?
Is my Airbag safe?
Airbag FAQ
Airbag T&Cs
Airbag Privacy
About
About FCAI
Board
Staff
Chairpersons
Members
Annual Reports
Policy Priorities
Policy Priorities
Safety
Environment
Emerging Technology
Service & Repair
End-Of-Life Vehicles
Submissions
The Industry
The Industry
New Car Industry
Motorcycle & OHV
Codes of Practice
News & Media
VFACTS
Search for:
Home
Is my Airbag safe?
Is my Airbag safe?
Airbag FAQ
Airbag T&Cs
Airbag Privacy
About FCAI
About FCAI
Board
Annual Reports
Chairpersons
Members
Annual Reports
Policy Priorities
Policy Priorities
Safety
Environment
Emerging Technology
Service & Repair
Submissions
The Industry
The Industry
New Car Industry
Motorcycles & OHV
Codes of Practice
News And Media
News And Media
News
Publications
VFACTS. The Benchmark for Australian Automotive Industry Data
Contact
Member Portal
The Industry
Home
›
The Industry
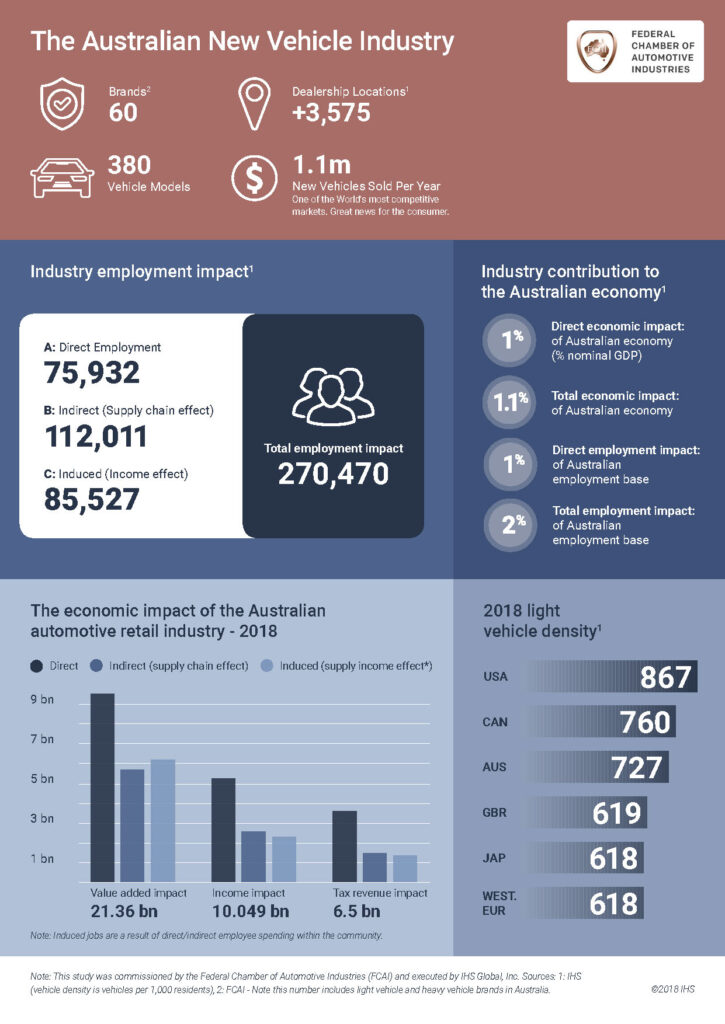
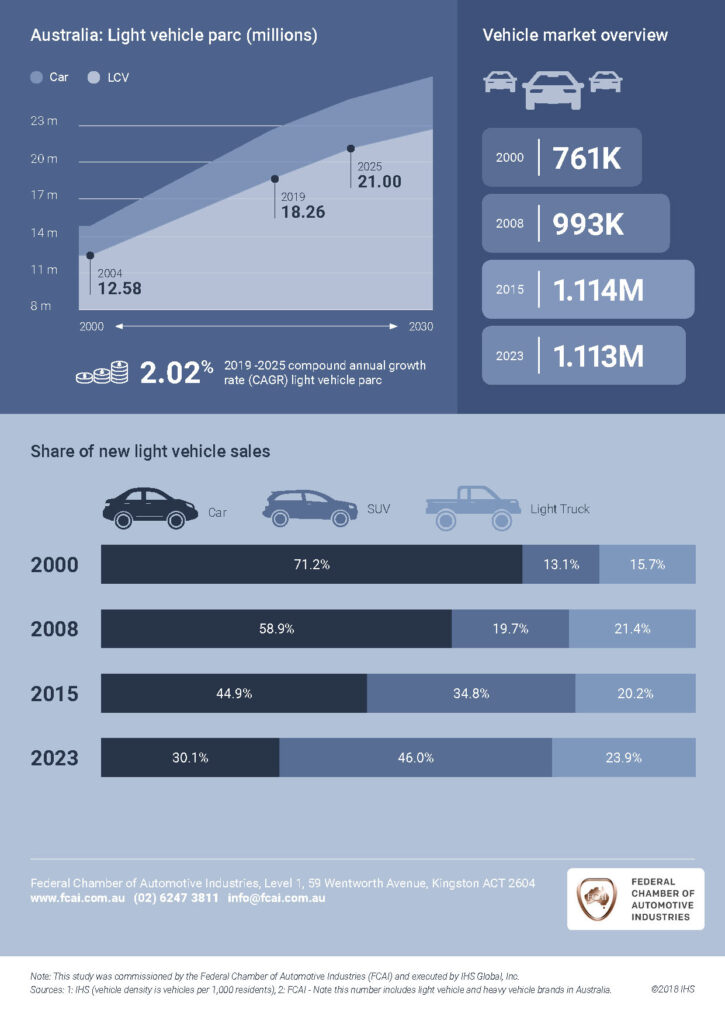
Download Fact Sheet – The Australian New Vehicle Industry (PDF)
In this section
New Car Industry
Codes of Practice
Motorcycles & OHV
In this section
New Car Industry
Codes of Practice
Motorcycles & OHV